This is a comprehensive Power BI project that showcases both Sales Performance and Human Resources Analytics. By combining these two distinct domains, you demonstrate a versatile ability to handle diverse business datasets—a huge plus for your portfolio.
Below is a breakdown of the project, followed by a professional template you can use for LinkedIn and your website.
🏗️ Project Breakdown & Analysis
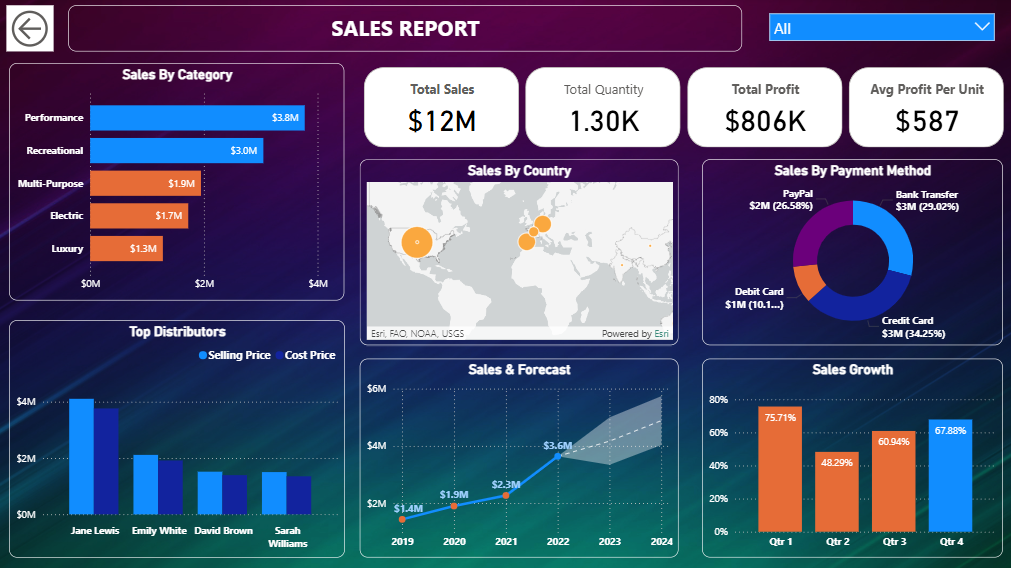
1. The Sales Dashboard (Executive View)
This dashboard focuses on revenue generation and operational efficiency.
- Key Metrics (KPIs): Total Sales, Total Quantity Sold, and Average Cost per Unit.
- Visualizations:
- Time-Series Analysis: A line chart showing sales trends over years/months to identify seasonality.
- Product Performance: Bar charts ranking “WaveX” products (R1, R2, P4, etc.) to identify top performers.
- Geographic/Distributor Insights: Analyzing which distributors (DL1–DL9) are driving the most volume.
- Payment Analysis: Understanding the preferred payment methods (Credit Card, PayPal, etc.).
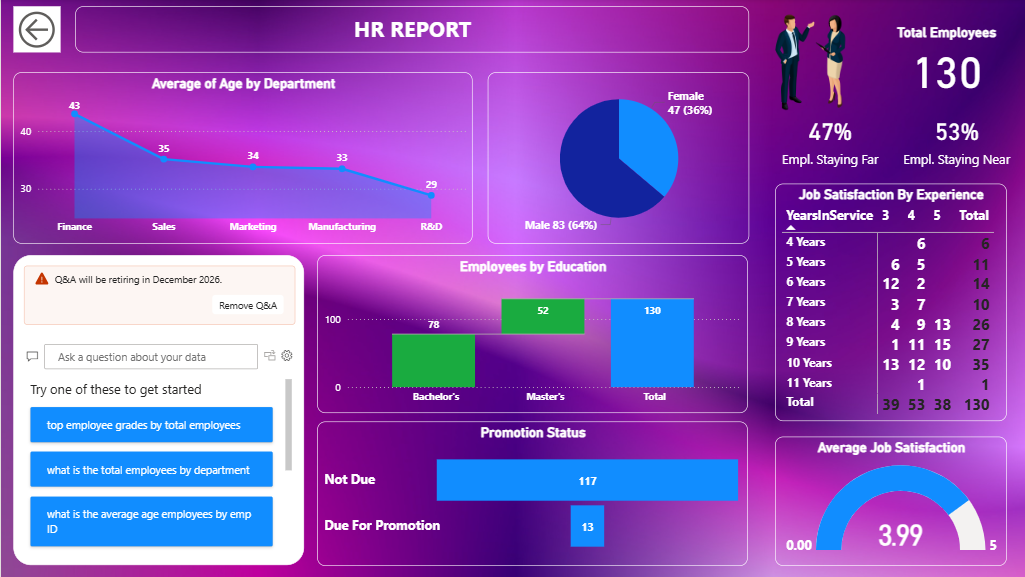
2. The HR Dashboard (People Analytics)
This dashboard focuses on workforce demographics and employee satisfaction.
- Key Metrics: Total Employee Count, Average Age, and Average Job Satisfaction.
- Visualizations:
- Demographics: Gender distribution (Male vs. Female) and Education levels (Bachelor’s vs. Master’s).
- Departmental Split: Headcount across Sales, R&D, Marketing, and Manufacturing.
- Satisfaction vs. Promotion: A matrix or chart correlating years since promotion with job satisfaction.
Objective: To provide the WaveX leadership team with a 360-degree view of company health, encompassing both financial performance and human capital management.
The Solution: I developed two interconnected dashboards using Power BI Desktop, later publishing them to the Power BI Service for mobile and web accessibility.
What I Built:
- Sales Performance Hub: Analyzed transaction data for 9 product lines. Used DAX to calculate profit margins and shipping costs, providing a clear view of the bottom line.
- Workforce Insight Dashboard: Created a demographic breakdown of the company’s 100+ employees, helping HR identify departments with low satisfaction scores and high promotion gaps.
Key Learnings & Skills Mastered:
- The Power BI Workflow: From connecting diverse sources (CSV/Excel) to publishing on the Cloud.
- Data Transformation: Mastering Power Query to handle nulls, data types, and merging “Category” and “Product Name” lookup tables.
- The “Star Schema”: Built a solid data model to ensure fast report performance.
- Visual Storytelling: Used Gauge visuals for KPIs and Matrix visuals for deep-dive analysis.
- DAX & M Language: Wrote custom formulas to create dynamic insights that change based on user slicers.